idstools.view.domain.ecstray
Module Contents
- class idstools.view.domain.ecstray.EcStrayView(equilibrium_ids: object, core_profiles_ids: object, waves_ids: object)[source]
- core_profiles_ids
- ecstray_object
- equilibrium_compute
- equilibrium_ids
- waves_ids
-
plot_cut_off_layer(ax, coherent_wave_index, time_slice, init=
1, verbose=False)[source]¶ Plot the cutoff layer on the given ax object.
- Parameters:
- ax
The matplotlib Axes object on which the cutoff layer will be plotted.
- time_slice
The time index for accessing wave-related data. Default is 0.
- init=
1¶ Indicates if the function is called for the initial setup. Set to 1 for initial setup. Default is 1.
- verbose=
False¶ Controls whether verbose output should be displayed. Default is False.
- Returns:
The Line2D object representing the cutoff layer plot.
- Return type:
Example
from idstools.view.domain.ecstray import EcStrayView
import imas
from idstools.view.common import PlotCanvas

connection = imas.DBEntry("imas:mdsplus?user=public;pulse=134173;run=2326;database=TEST;version=3", "r")
connection.open()
equilibriumIds = connection.get('equilibrium')
wavesIds = connection.get('waves')
coreProfilesIds = connection.get('core_profiles')

canvas = PlotCanvas(1, 1) # create canvas
ax = canvas.add_axes(title="Resonance Layer", xlabel="R [m]", ylabel="Z [m]", row=0, col=0, rowspan=1)
ax.set_title("uri=imas:mdsplus?user=public;pulse=134173;run=2326;database=TEST;version=3")
ecstrayView = EcStrayView(equilibriumIds, coreProfilesIds, wavesIds)
ecstrayView.plot_cut_off_layer(ax, time_slice=0,verbose=True)

ax.plot()
canvas.show()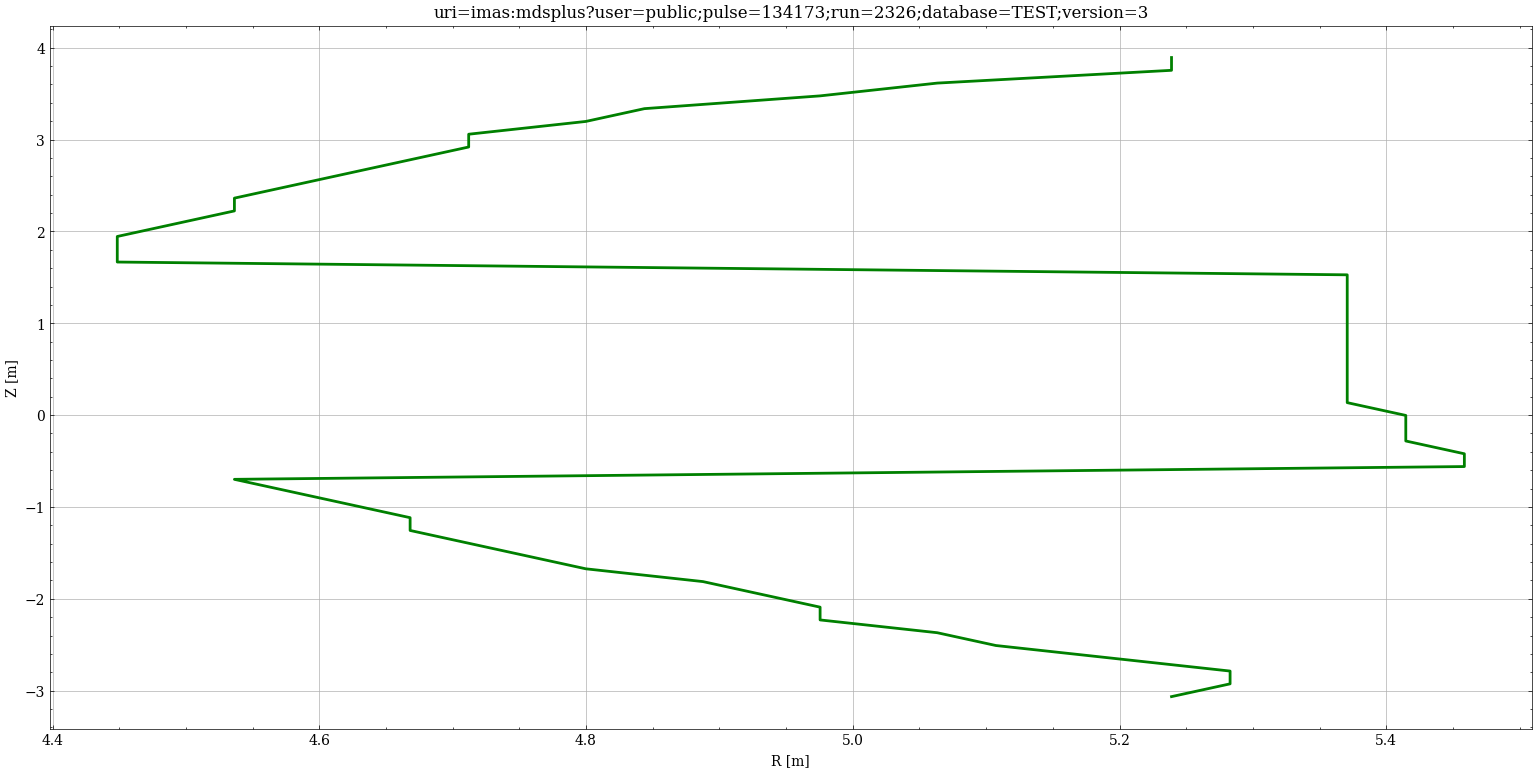
See also
idstools.domain.ecstray.EcStrayCompute.getCutoffLayer()
-
plot_resonance_layer(ax, coherent_wave_index, time_slice, init=
1, verbose=False)[source]¶ Plot the resonance layer on the given ax object.
- Parameters:
- ax
The matplotlib Axes object on which the resonance layer will be plotted.
- time_slice
The time slice for accessing wave-related data.
- init=
1¶ Indicates if the function is called for the initial setup. Set to 1 for initial setup. Default is 1.
- verbose=
False¶ Controls whether verbose output should be displayed. Default is False.
- Returns:
The Line2D object representing the resonance layer plot.
- Return type:
Example
from idstools.view.domain.ecstray import EcStrayView
import imas
from idstools.view.common import PlotCanvas

connection = imas.DBEntry("imas:mdsplus?user=public;pulse=134173;run=2326;database=TEST;version=3", "r")
connection.open()
equilibriumIds = connection.get('equilibrium')
wavesIds = connection.get('waves')
coreProfilesIds = connection.get('core_profiles')

canvas = PlotCanvas(1, 1) # create canvas
ax = canvas.add_axes(title="Resonance Layer", xlabel="R [m]", ylabel="Z [m]", row=0, col=0, rowspan=1)
ax.set_title("uri=imas:mdsplus?user=public;pulse=134173;run=2326;database=TEST;version=3")
ecstrayView = EcStrayView(equilibriumIds, coreProfilesIds, wavesIds)
ecstrayView.plot_resonance_layer(ax, time_slice_wv=0, time_slice_eq=0, verbose=True)

ax.plot()
canvas.show()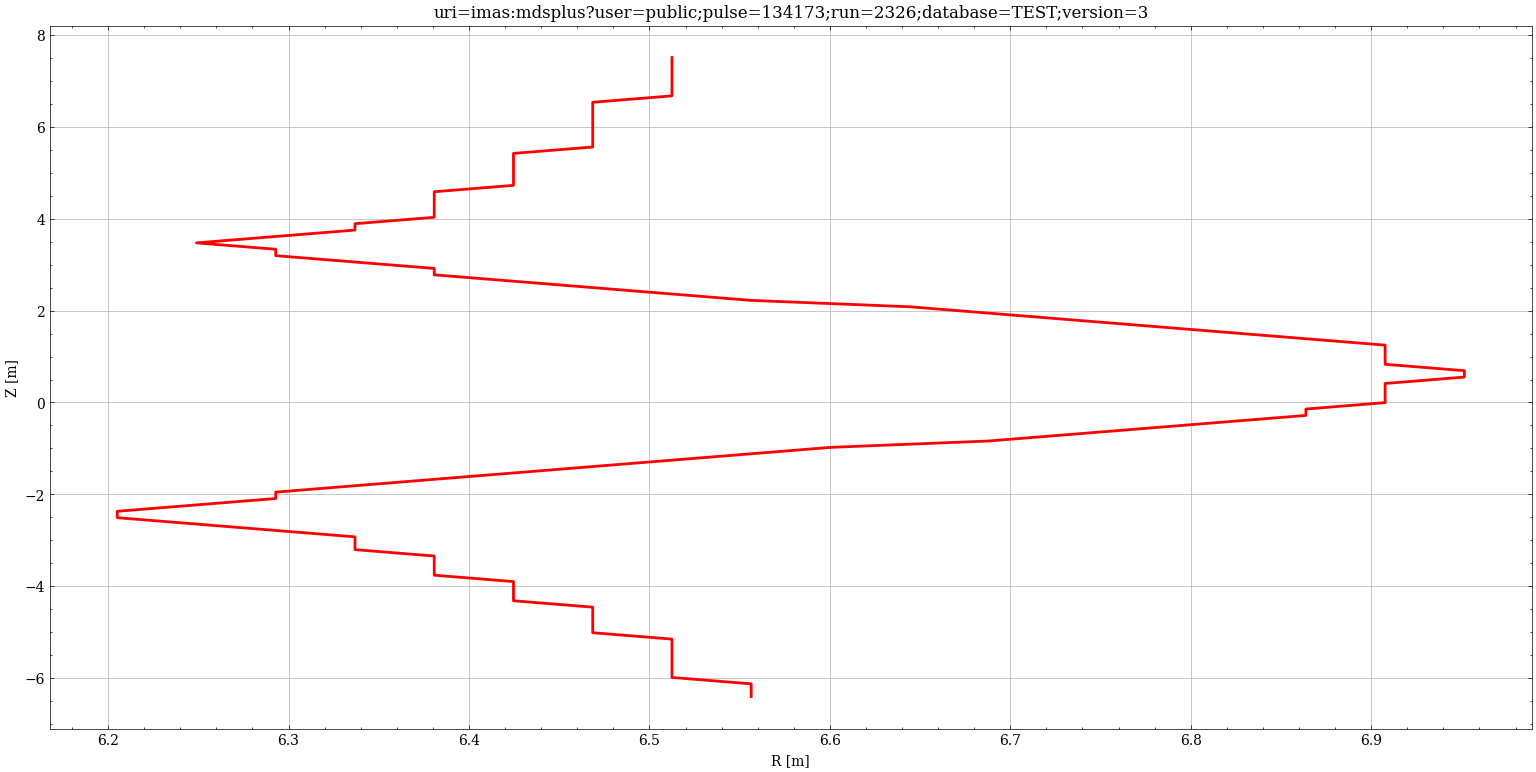
-
idstools.view.domain.ecstray.bndcolor =
"'chocolate'"
-
idstools.view.domain.ecstray.colorcounter =
'0'
- idstools.view.domain.ecstray.logger
-
idstools.view.domain.ecstray.lpad =
'-1'
-
idstools.view.domain.ecstray.shotcolors =
"['b', 'r', 'c', 'y', 'm', 'b']"
-
idstools.view.domain.ecstray.shotstyle =
"['-', '--', '-.', ':', '.', ',']"