idstools.view.equilibrium
This module provides view functions and classes for equilibrium ids data
Module Contents
- class idstools.view.equilibrium.EquilibriumView(ids: object)[source]
Bases:
idstools.view.common.BasePlotThis is a constructor function that initializes an object with an input object and creates another object using the input object.
- Parameters:
- compute_obj
- ids
- plot_poloidal_equilibrium(ax, time_slice: int)[source]
This function plots a poloidal equilibrium contour plot using flux surface quantities extracted from the equilibrium.
-
plot_topplotequilibrium(ax, time_slice, label=
'Plasma Boundaries')[source]¶ This function plots the top view equilibrium of a plasma and updates the plot if specified.
-
view_magnetic_poloidal_flux(ax: matplotlib.pyplot.axes, time_slice: int, profiles2d_index: int =
0, plot_rho: bool =False)[source]¶ This function plots the magnetic poloidal flux contours on a 2D Cartesian grid.
- Parameters:
- ax: matplotlib.pyplot.axes
ax is a matplotlib axis object on which the magnetic poloidal flux contour plot will be drawn.
Example
import imas
from idstools.view.equilibrium import EquilibriumView
from idstools.view.common import PlotCanvas

connection = imas.DBEntry("imas:mdsplus?user=public;pulse=134174;run=117;database=ITER;version=3","r")
connection.open()
idsObj = connection.get('equilibrium')

canvas = PlotCanvas(1, 1) # create canvas
ax = canvas.add_axes(title="", xlabel="", row=0, col=0)

viewObj = EquilibriumView(idsObj)
viewObj.viewMagneticPoloidalFlux(ax) # plot contour on the canvas axes

ax.set_title("uri=imas:mdsplus?user=public;pulse=134174;run=117;database=ITER;version=3")
ax.plot()
canvas.show()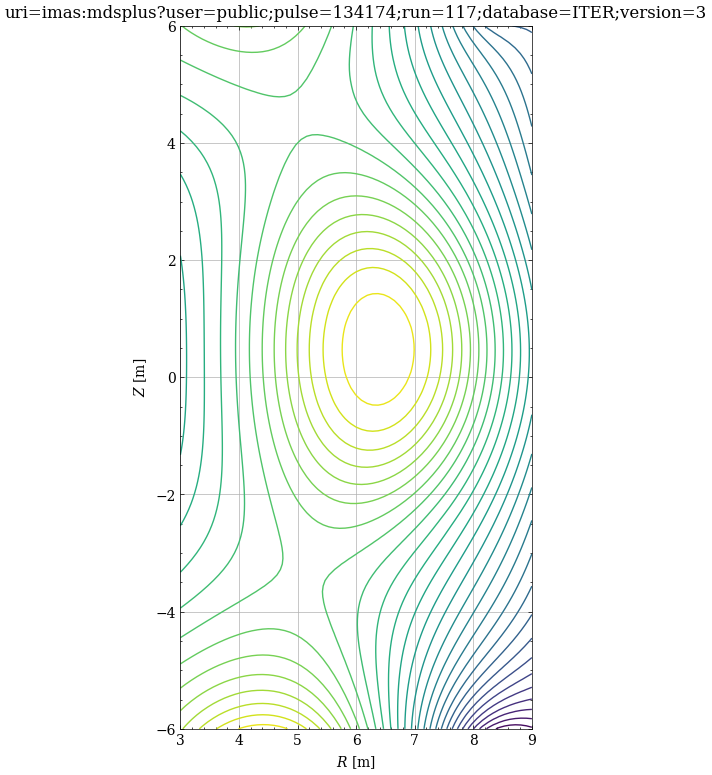
See also
idstools.compute.equilibrium.EquilibriumCompute.get2DCartesianGrid()idstools.compute.equilibrium.EquilibriumCompute.getRho2D()plotIP()
- view_pulse_info(ax: matplotlib.pyplot.axes, title: str, hostdir: str, shot: int, run: int, t: float)[source]
- view_time_line(ax, time)[source]
The function view_time_line plots a vertical dashed line on a given matplotlib axis at a specified time.
- Parameters:
- ax
The parameter “ax” is a reference to the second y-axis of a matplotlib figure. It is used to plot the timeline on the same figure as the other data.
- time
The “time” parameter is the value at which you want to plot a vertical line on the timeline. It represents the specific point in time that you want to highlight on the timeline.
- idstools.view.equilibrium.logger