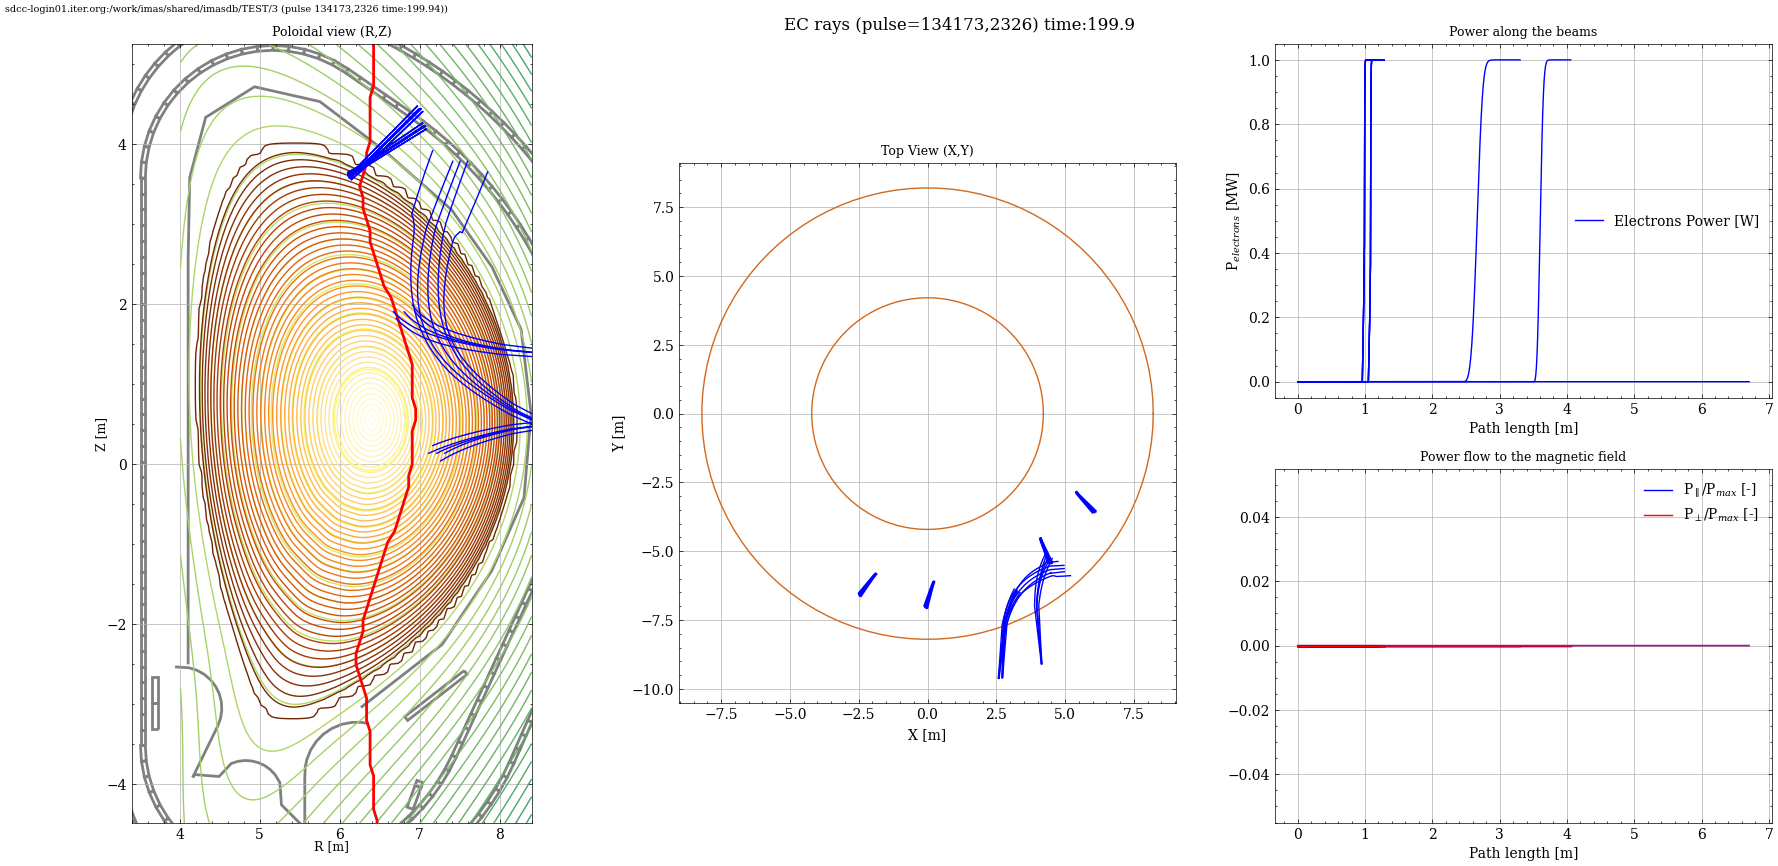
plotecray
plotecray shows plots for RF Waves and depositions. This script uses output of TORBEAM code. refer data dictionary.
Syntax plotecray
$ plotecray -h
Usage: plotecray [-h] -u URI [--dd-update] [--rc RC] [-md [MD ...]] [-t TIME]
                 [--save] [--directory DIRECTORY]

---- Display EC wave ray-tracing results [Previously known as ecray]

Options:
  -h, --help            show this help message and exit
  -u, --uri URI         URI of the dataentry (e.g, imas:hdf5?path=./testdb or
                        ./testpulse.nc)
  --dd-update           Convert IDS to the default version of the data
                        dictionary if enabledotherwise, use the original IDS
                        stored on disk.
  --rc RC               Semicolon-separated rcParams string (e.g.,
                        'lines.linewidth=2;axes.titlesize=14')
  -md, --md [MD ...]    Provide machine descriptions that you need to plot
                        with ids names for example wall pf_active or with uris
                        for example
                        "imas:mdsplus?user=public;shot=116000;run=4;database=I
                        TER_MD;version=3#wall",
                        "imas:mdsplus?user=public;shot=116000;run=4;database=I
                        TER_MD;version=3", "imas:hdf5?path=./testdb",
                        "testpulse.nc"
  -t, --time TIME       Time
  --save                Save figure at default location
  --directory DIRECTORY
                        Directory to save the figure
Example plotecray
$ plotecray --uri "imas:mdsplus?user=public;pulse=134173;run=2326;database=TEST;version=3" -md wall