plotkineticprofiles
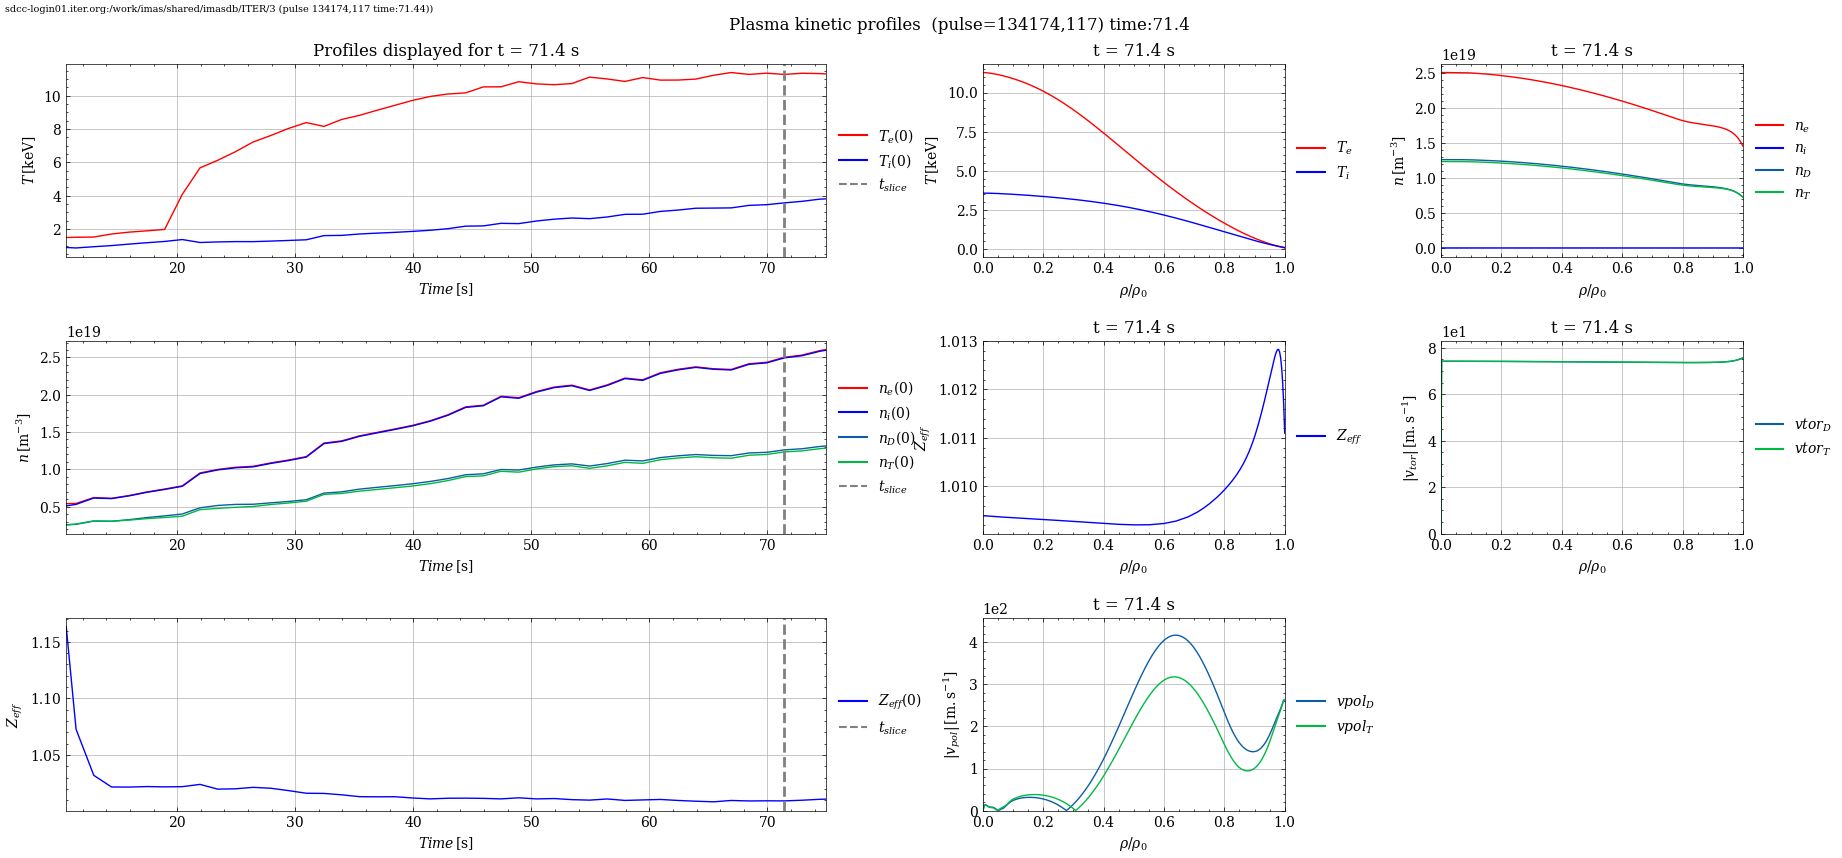
plotkineticprofiles shows plasma kinetic profiles from the core_profiles IDSs refer data dictionary.
Syntax plotkineticprofiles
$ plotkineticprofiles -h
Usage: plotkineticprofiles [-h] -u URI [--dd-update] [--rc RC] [-t TIME] [-e]
                           [--verbose] [--logscale] [--save]
                           [--directory DIRECTORY]

---- Display the plasma kinetic profiles from the core_profiles IDSs

Options:
  -h, --help            show this help message and exit
  -u, --uri URI         URI of the dataentry (e.g, imas:hdf5?path=./testdb or
                        ./testpulse.nc)
  --dd-update           Convert IDS to the default version of the data
                        dictionary if enabledotherwise, use the original IDS
                        stored on disk.
  --rc RC               Semicolon-separated rcParams string (e.g.,
                        'lines.linewidth=2;axes.titlesize=14')
  -t, --time TIME       Time
  -e, --edge            Add redge profiles if available
  --verbose             Verbose output
  --logscale            Shows y axis with logarithmic scale wherever
                        appropriate
  --save                Save figure at default location
  --directory DIRECTORY
                        Directory to save the figure
Example plotkineticprofiles
$ plotkineticprofiles --uri "imas:mdsplus?user=public;pulse=134174;run=117;database=ITER;version=3"
Time  = 71.44 s in range [10.60,75.00] s
Index = 53
Averaged resolution = 0.6133411929278538 s
Time  = 71.44 s in range [1.20,149.44] s
Index = 53
Averaged resolution = 1.4117675982100488 s
Ti_flag : 1, Ti_e_flag : 0
------------
species:      D       T       Be
a:            2.0     3.0     9.0
z:            1.0     1.0     4.0
n_over_ntot:  0.504   0.495   0.001
n_over_ne:    0.502   0.494   0.001
n_over_n_maj: 1.000   0.984   0.002