plotspectrometry
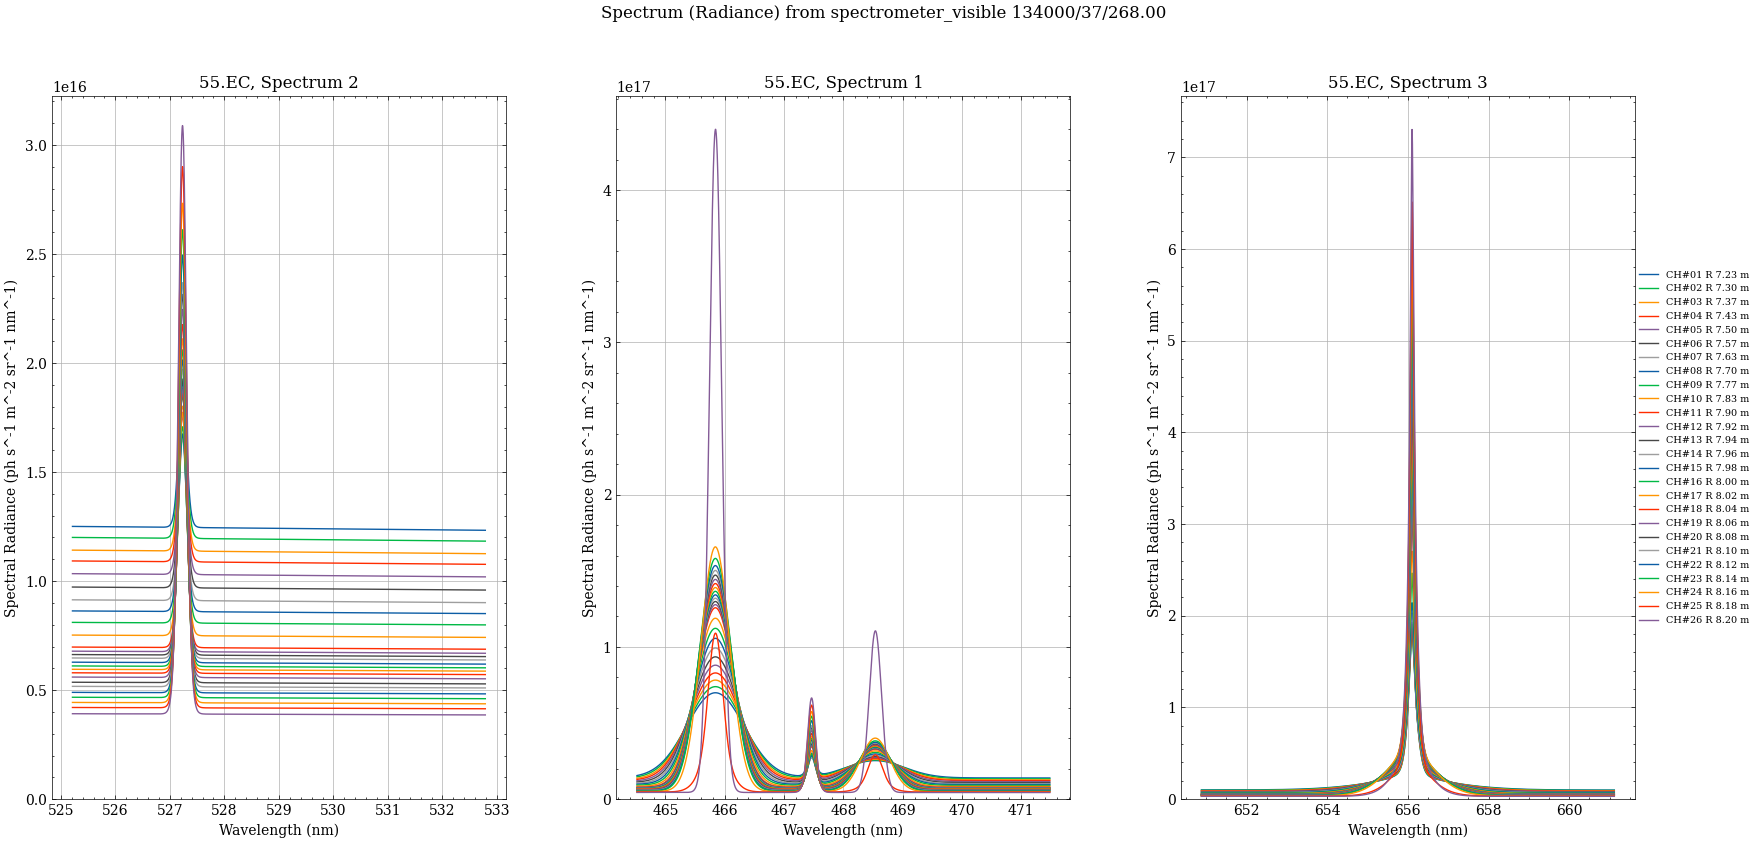
plotspectrometry Display the spectrum from spectrometer_visible idses. It shows plots of radiance and intensity of the spectrom. refer data dictionary.
Syntax plotspectrometry
$ plotspectrometry -h
Usage: plotspectrometry [-h] -u URI [--dd-update] [--rc RC] [-t TIME]
                        [--logscale] [--save] [--directory DIRECTORY]

---- Display spectrum from spectrometer_visible

Options:
  -h, --help            show this help message and exit
  -u, --uri URI         URI of the dataentry (e.g, imas:hdf5?path=./testdb or
                        ./testpulse.nc)
  --dd-update           Convert IDS to the default version of the data
                        dictionary if enabledotherwise, use the original IDS
                        stored on disk.
  --rc RC               Semicolon-separated rcParams string (e.g.,
                        'lines.linewidth=2;axes.titlesize=14')
  -t, --time TIME       Time
  --logscale            Shows y axis with logarithmic scale wherever
                        appropriate
  --save                Save figure at default location
  --directory DIRECTORY
                        Directory to save the figure
Example plotspectrometry
$ plotspectrometry --uri "imas:mdsplus?user=public;pulse=134000;run=37;database=TEST;version=3"