plotecstrayradiation
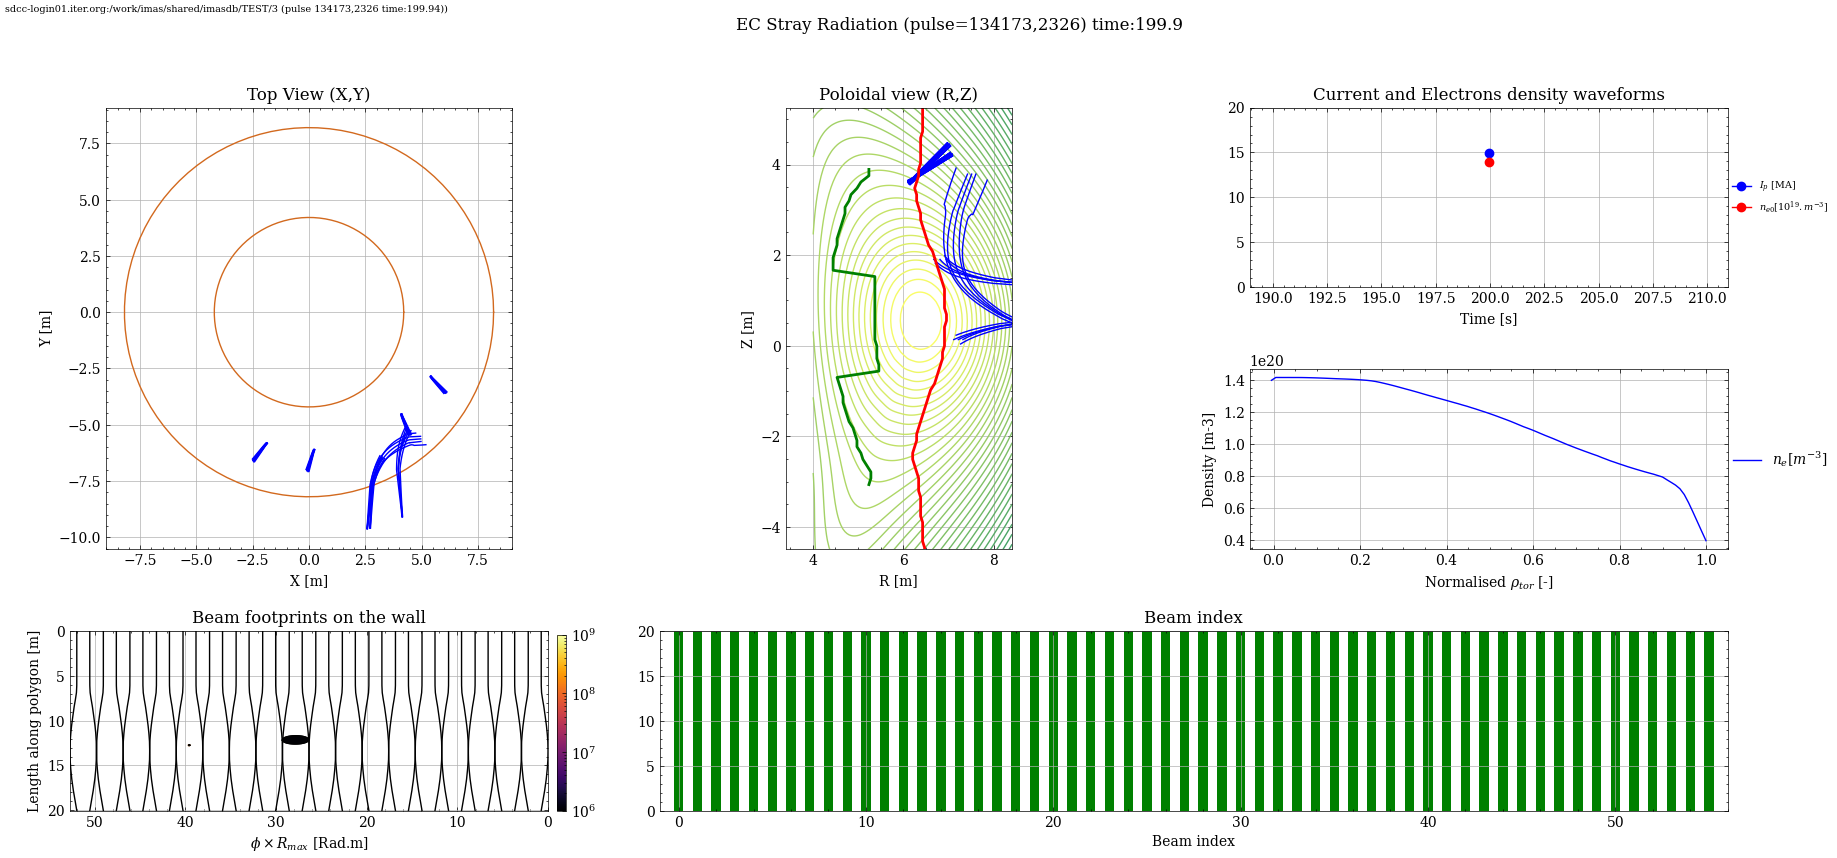
plotecstrayradiation script shows electron cyclotron stray radiation information by showing different plots. It shows cut off layer, resonance layer, top view equilibrium. refer data dictionary.
Note
This program is experimental and currently is in development.
Syntax plotecstrayradiation
$ plotecstrayradiation -h
Usage: plotecstrayradiation [-h] -u URI [--dd-update] [--rc RC] [-t TIME]
                            [--logscale] [--save] [--directory DIRECTORY]

---- Shows electron cyclotron stray radiation information by showing different
plots

Options:
  -h, --help            show this help message and exit
  -u, --uri URI         URI of the dataentry (e.g, imas:hdf5?path=./testdb or
                        ./testpulse.nc)
  --dd-update           Convert IDS to the default version of the data
                        dictionary if enabledotherwise, use the original IDS
                        stored on disk.
  --rc RC               Semicolon-separated rcParams string (e.g.,
                        'lines.linewidth=2;axes.titlesize=14')
  -t, --time TIME       Time (default=middle)
  --logscale            Shows y axis with logarithmic scale wherever
                        appropriate
  --save                Save figure at default location
  --directory DIRECTORY
                        Directory to save the figure
Example ecstray
$ plotecstrayradiation --uri "imas:mdsplus?user=public;pulse=134173;run=2326;database=TEST;version=3"