plothcdwaves
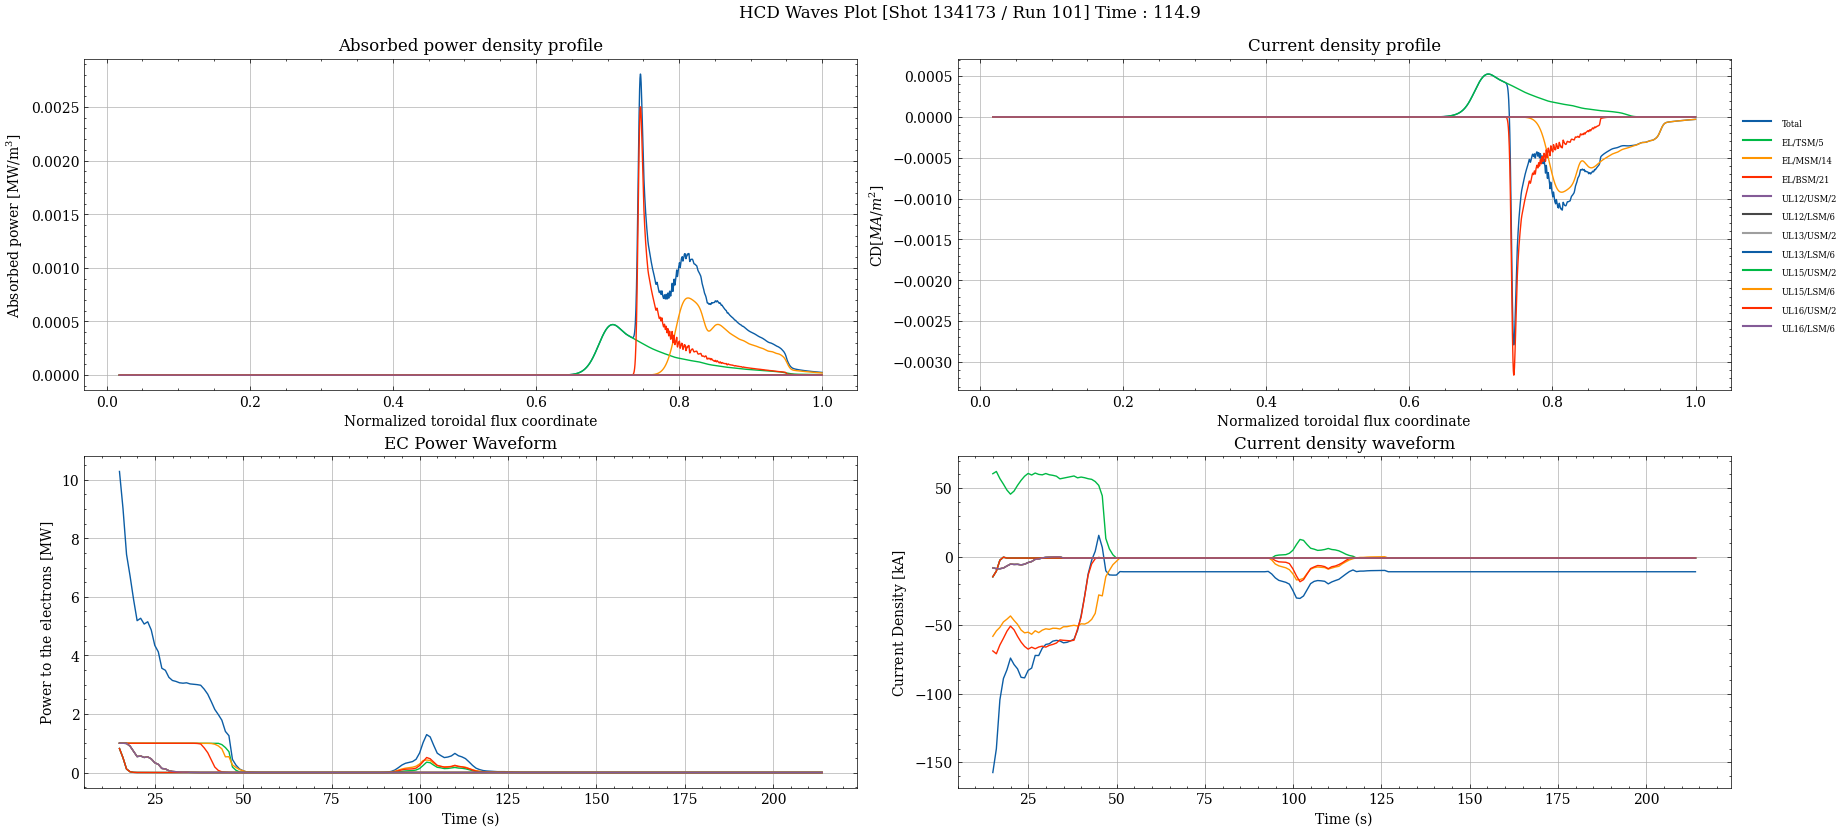
plothcdwaves shows hcd waveforms
Syntax plothcdwaves
$ plothcdwaves -h
Usage: plothcdwaves [-h] -u URI [--dd-update] [--rc RC] [-t TIME] [-f] [-l]
                    [--save] [--directory DIRECTORY]

---- Display EC results

Options:
  -h, --help            show this help message and exit
  -u, --uri URI         URI of the dataentry (e.g, imas:hdf5?path=./testdb or
                        ./testpulse.nc)
  --dd-update           Convert IDS to the default version of the data
                        dictionary if enabledotherwise, use the original IDS
                        stored on disk.
  --rc RC               Semicolon-separated rcParams string (e.g.,
                        'lines.linewidth=2;axes.titlesize=14')
  -t, --time TIME       Time
  -f, --force_psi       force displaying the profiles versus poloidal flux
  -l, --hide_legend     remove the legend from graphs
  --save                Save figure at default location
  --directory DIRECTORY
                        Directory to save the figure
Example plothcdwaves
$ plothcdwaves --uri "imas:mdsplus?user=public;pulse=134173;run=101;database=TEST;version=3"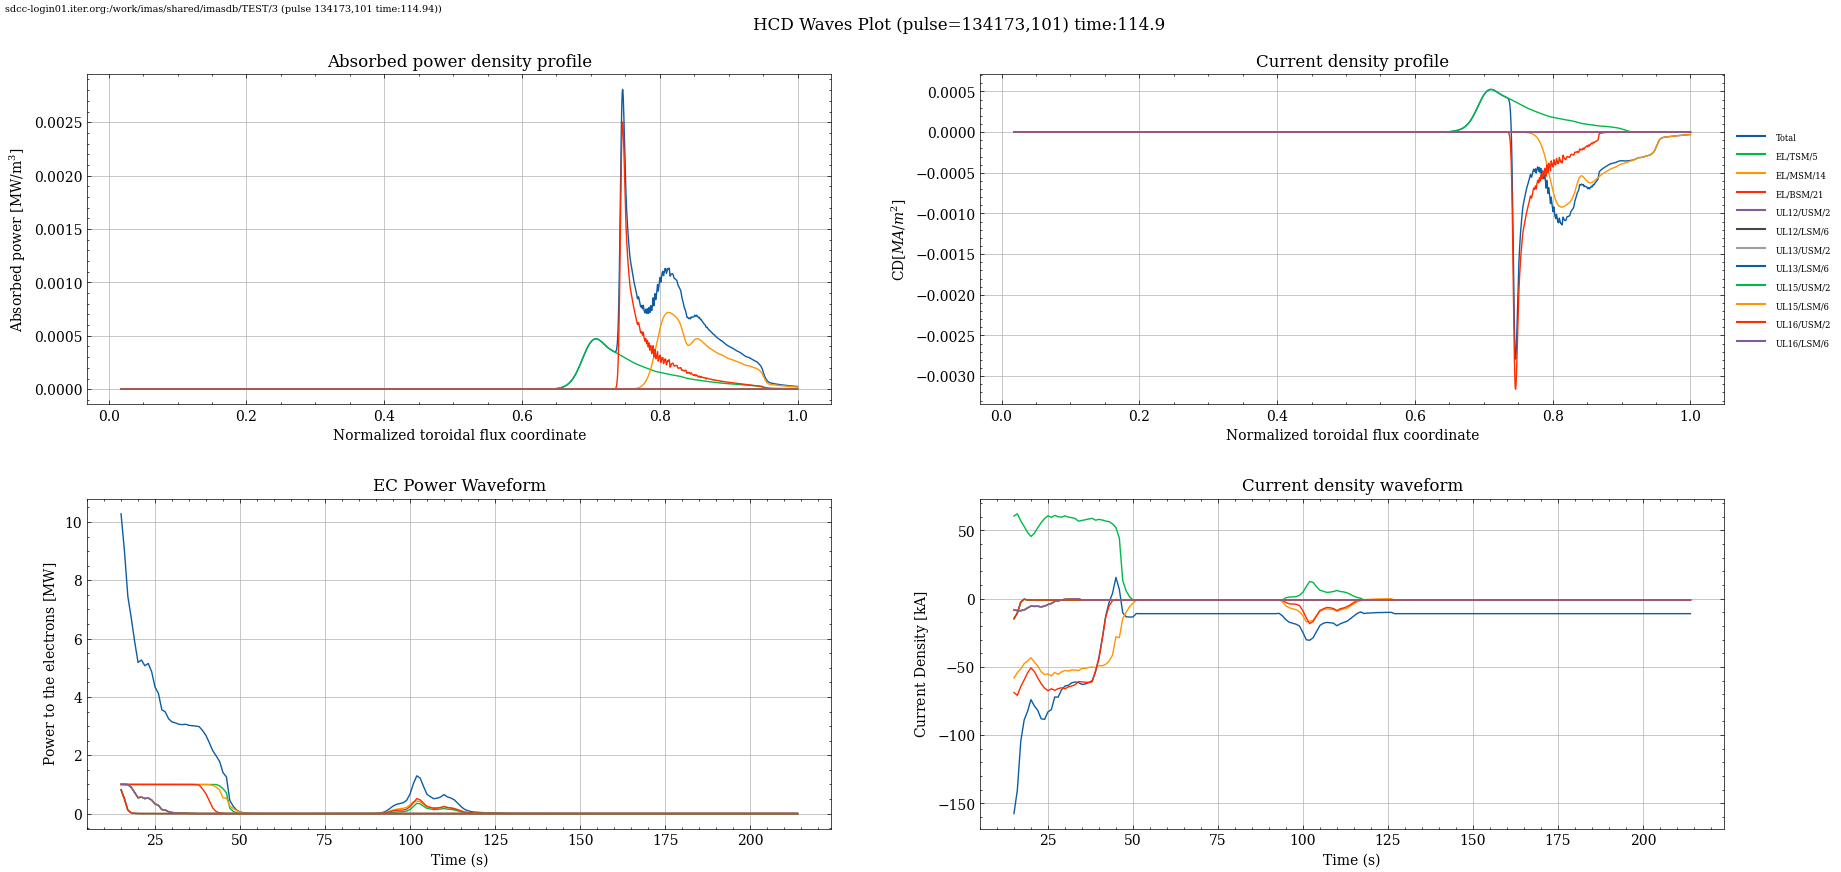
$ plothcdwaves --uri "imas:mdsplus?user=schneim;pulse=105039;run=1;database=SAVE;version=3" -t 25