plotedgeprofiles
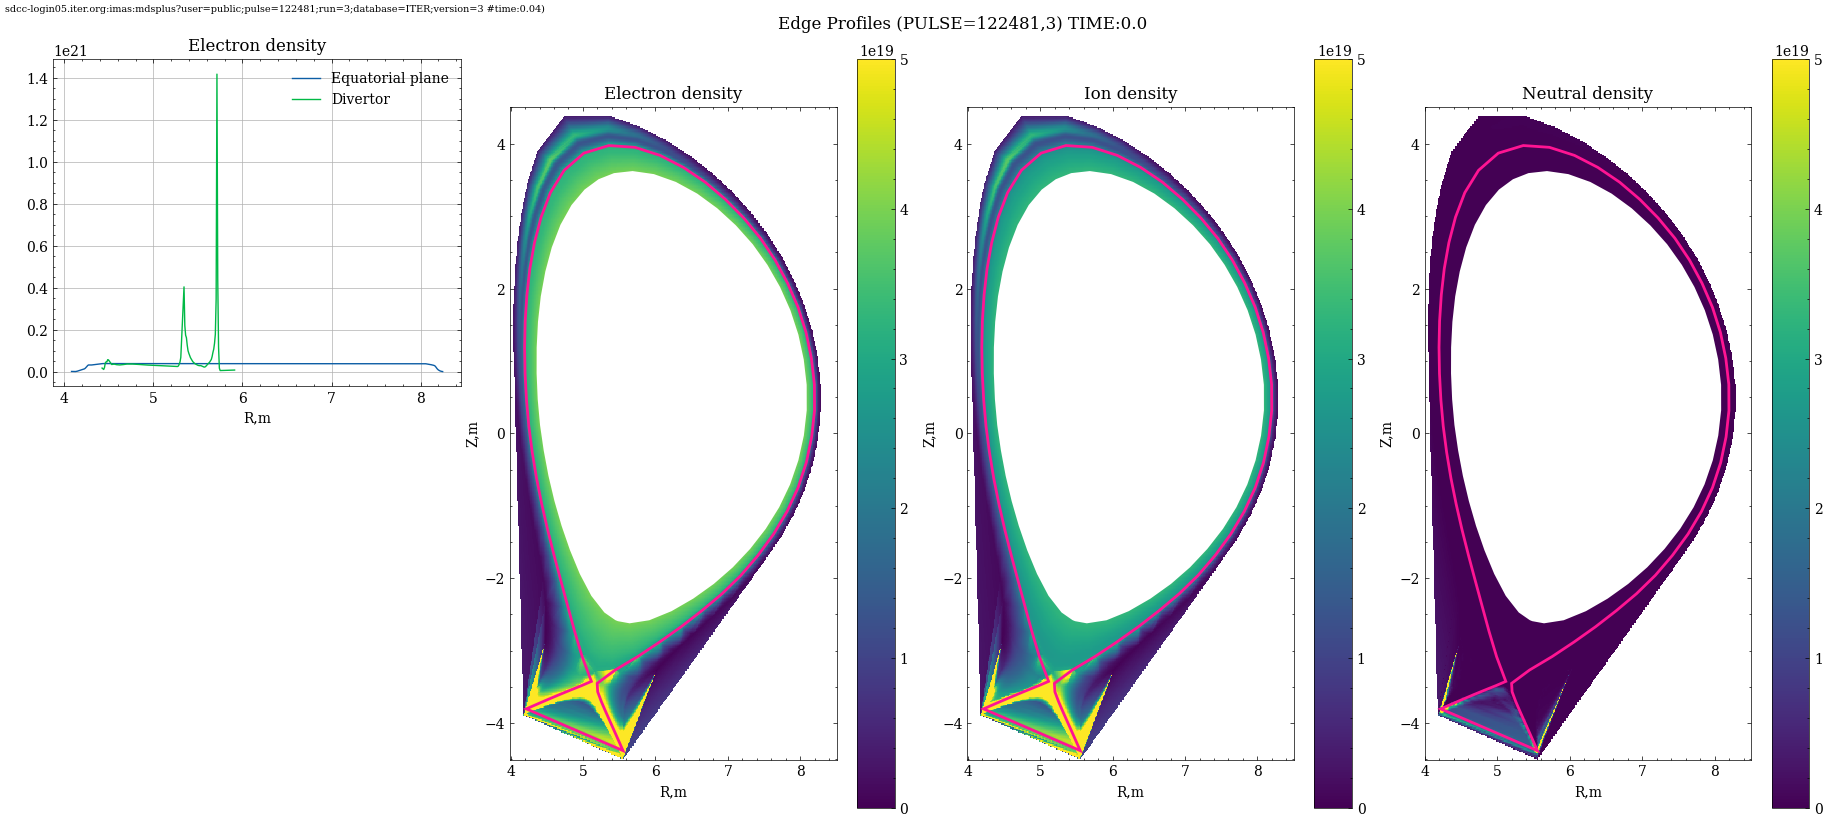
plotedgeprofiles script shows edge profiles plots by interpolating on rectangular grid. It shows Electrons, Ions and Neutral density plots. refer data dictionary.
Syntax plotedgeprofiles
$ plotedgeprofiles -h
Usage: plotedgeprofiles [-h] -u URI [--dd-update] [--rc RC] [-t TIME] [--wall]
                        [-w WALLURI] [--logscale] [--save]
                        [--directory DIRECTORY]

---- Edge Profile plot

Options:
  -h, --help            show this help message and exit
  -u, --uri URI         URI of the dataentry (e.g, imas:hdf5?path=./testdb or
                        ./testpulse.nc)
  --dd-update           Convert IDS to the default version of the data
                        dictionary if enabledotherwise, use the original IDS
                        stored on disk.
  --rc RC               Semicolon-separated rcParams string (e.g.,
                        'lines.linewidth=2;axes.titlesize=14')
  -t, --time TIME       Time
  --wall                Show wall
  -w, --walluri WALLURI
                        Show wall ids from this uri (e.g.
                        imas:hdf5?path=./testdb or ./testpulse.nc)
  --logscale            Shows y axis with logarithmic scale wherever
                        appropriate
  --save                Save figure at default location
  --directory DIRECTORY
                        Directory to save the figure
Example plotedgeprofiles
$ plotedgeprofiles --uri "imas:mdsplus?user=public;pulse=134174;run=117;database=ITER;version=3" --wall --time 60
$ plotedgeprofiles --uri "imas:mdsplus?user=public;pulse=123314;run=1;database=ITER;version=3"